Overview
The Strategy Execution Report helps you monitor how well your organization is executing on strategic initiatives by tracking semaphore status (🟢 🟠 🔴) across all organizational levels. It provides a clear view of execution health, helping you identify areas needing attention before they become critical.
Accessing the Report
Location: Navigate to Manage > Strategy Execution Report in the main navigation.
Required Permission: Users need the enterprises:manage permission to access this report (typically enterprise admins and strategy leaders).
Understanding Health Scores
Each organizational level receives a health score based on the semaphore status of items at that level:
- 🟢 Green (On Track): 100 points
- 🟠 Yellow (At Risk): 50 points
- 🔴 Red (Critical): 0 points
- ⚪ Not Set: Excluded from calculation
Calculation: The health score is the average of all points from items with a set status.
Example: If a level has 3 green items (300 points), 2 yellow items (100 points), and 1 red item (0 points), the health score is 400 ÷ 6 = 66.7%.
Health Score Ranges
- 80%+ (Green): Healthy execution, most items on track
- 60-79% (Yellow): Moderate risk, attention needed
- <60% (Red): High risk, significant execution challenges
Using Filters
The report supports two types of filters to help you focus on specific areas:
OP Element Filter
- All - Shows semaphores from all content types
- Initiatives - Focus on initiative-level execution (currently most active)
- Pillars - Coming soon (disabled until semaphores are enabled)
- Enablers - Coming soon (disabled until semaphores are enabled)
- Strategic Fields - Coming soon (disabled until semaphores are enabled)
Semaphore Status Filter
- All - Shows all semaphore statuses
- 🔴 Critical - Items requiring immediate attention
- 🟠 At Risk - Items needing monitoring
- 🟢 On Track - Items performing well
- ⚪ Not Set - Items with semaphores enabled but no status set
Interpreting the Report
The report shows two main sections:
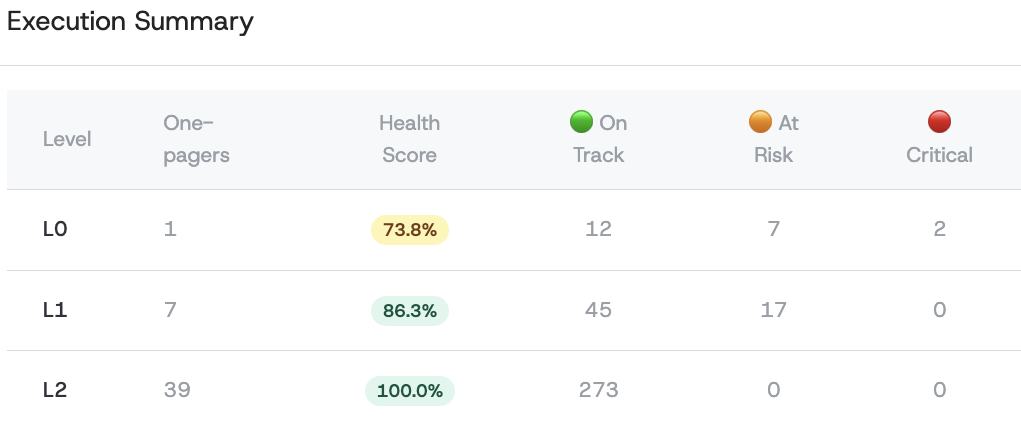
Summary Table
- Level - Organizational level (L0, L1, L2, etc.)
- # OPs - Count of one-pagers at this level
- Health Score - Overall execution health percentage with color coding
- Status Distribution - Count of items by semaphore status (🟢 🟠 🔴 ⚪)
- Total Items - Total semaphore-enabled items at this level
Level Details
For each level with semaphore data, you'll see:
- One-Pager - Source one-pager title (clickable link)
- Item - Specific item name (initiative, pillar, etc.)
- OP Element - Content type (Initiative, Pillar, etc.)
- Status - Visual semaphore indicator
- Status Narrative - Detailed explanation of current status
Best Practices
For Strategy Leaders
- Regular Review - Check execution health weekly during strategic cycles
- Focus on Critical Items - Address 🔴 items within 24-48 hours
- Monitor Trends - Track health score changes over time
- Identify Patterns - Look for levels or areas consistently showing risk
For Team Leads
- Keep Status Current - Update semaphore status at least weekly
- Write Clear Narratives - Provide specific, actionable status reports
- Early Warning - Flag items as 🟠 before they become 🔴
- Include Context - Document blockers, dependencies, and mitigation plans
Common Use Cases
Executive Dashboard
Use All/All filters for a comprehensive organizational health view. Focus on red items for immediate escalation needs.
Initiative Management
Filter by Initiatives/All for execution oversight. Use Initiatives/Critical to identify urgent interventions.
Risk Assessment
- Critical filter shows items requiring immediate attention
- At Risk filter identifies emerging issues
- Not Set filter finds items missing status updates
Semaphore Visibility and Permissions
Semaphore visibility is controlled by ownership and organizational roles. This ensures that sensitive execution status is only visible to those who need to see it.
Who Can See Semaphores
| Role/Context | Can View | Can Edit |
|---|---|---|
| Enterprise Admin | All semaphores | All semaphores |
| Owner of the one-pager | Yes | Yes |
| Owner of a parent one-pager | Yes (entire subtree) | Yes (entire subtree) |
| Owner of a child one-pager | Parent's semaphores only | No |
| Enterprise Collaborator | Only if transparency mode enabled | Only owned items |
| Enterprise Viewer | Only if transparency mode enabled | No |
Understanding Ownership
When you create a one-pager or are assigned as its author, you become its owner. Ownership grants you:
- View access to semaphores on your one-pager and all its children (subtree)
- Edit access to update semaphore status on your one-pager and children
- Parent visibility - you can see (but not edit) semaphores on parent one-pagers
Example: If you own an L2 initiative:
- ✅ You can view and edit semaphores on your L2 one-pager
- ✅ You can view and edit semaphores on any L3, L4 children you own
- ✅ You can view (read-only) the L1 and L0 parent semaphores
- ❌ You cannot edit parent semaphores
Ownership Requirements
To be assigned as an owner of a one-pager, you must have the Enterprise Collaborator role or higher. Users with the Enterprise Viewer role cannot own one-pagers because viewers are read-only and cannot edit content.
If you need to transfer ownership to someone, ensure they have at least Collaborator permissions first.
Full Transparency Mode
Organizations that prefer open visibility can enable Full Transparency Mode by contacting their administrator. When enabled:
- All users with
one_pagers:viewpermission can see semaphores across the organization - Edit permissions still follow the ownership rules above
This is useful for organizations with a culture of open communication about execution status.